


The advanced solution uses the windows based Presenter which allows for displaying of multiple outputs simultaneously and additional formatting and customisation. When opening the the Presenter for the solution, the configuration used to display this is saved in Remote Control Presenter 1, available from the dropdown. Note that this configuration has been optimised for a display with 1920*1080 resolution.
Below we explain the full steps to set this up, we recommend reading the Basic Solution first to understand the additional fields which were created and to understand the grouping and sorting used in the output.
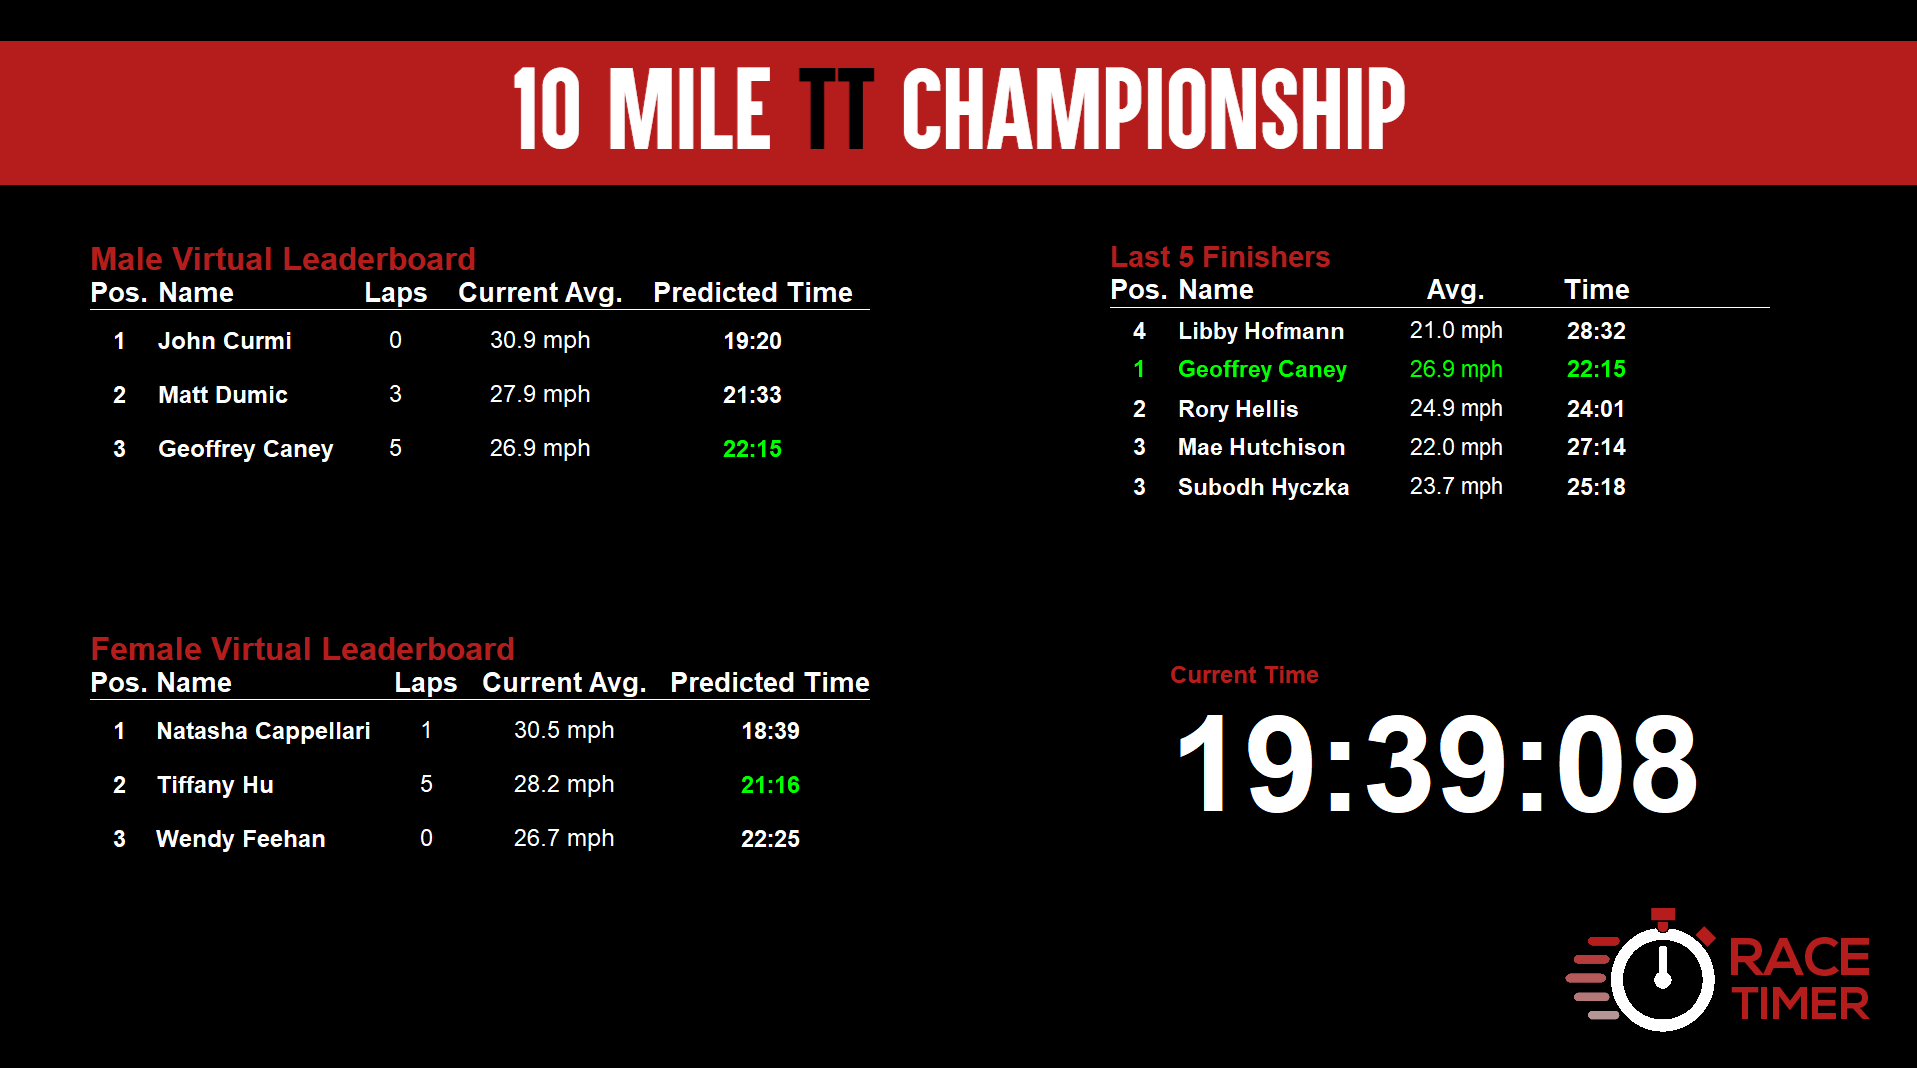
The display makes use of the Presenters ability to show multiple output lists using a single screen, and the display is divided in to 4 sections showing a virtual leaderboard for Males, virtual leaderboard for Females, the last 5 finishers and the current time of day.
Output Lists
This display uses 4 output lists, the leaderboard outputs are the same setup but filtered according to the relevant gender.
Virtual Leaderboard
Similar to the setup of the basic leaderboard this output is sorted by Finish.Predicted.Decimal, since we only have a single Contest and will use separate Outputs for Males / Females no other grouping / sorting is required.

The list is also filtered by Lap0.TimePositive and applies an additional filter by Gender for Males and Females accordingly. To keep the display simple we only show the top 3 leaders, so the Maximum Number of Records is set to 3

The fields used for this list are again very similar to the basic solution, and make use of the LapsCompleted result which we created earlier. This however uses AutoRank to simply rank the participants based on the grouping / sorting applied in the output.
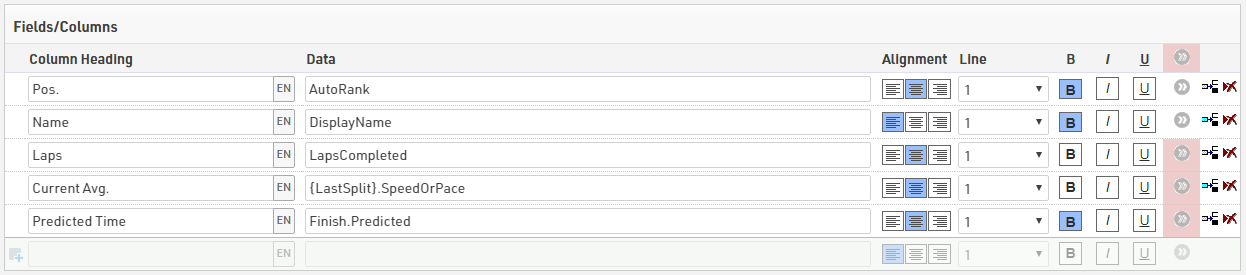
To again highlight those who had already finished we applied some Dynamic Formatting to the Predicted Time column, in this case changing the colour of the text to green if they have finished.
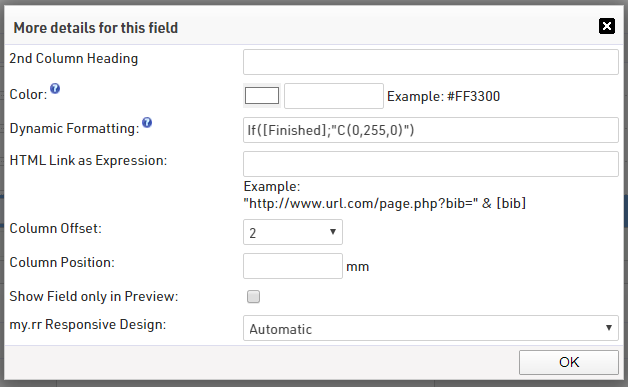
If([Finished];"C(0,255,0)")
There is some additional formatting and settings applied, which we will look at when we look at the display of data later on.
Last 5 Finishers
As per the task we wanted participants to be able to view their times and compare themselves to others, given that finishers are usually somewhat spread out at a Time Trial we opted to show just the last 5 finishers on the screen, this allows them to see their time and position, and also compare themselves to the virtual leaderboard.
As we are scoring by Chip Time for this race, to show the most recent finishers we need to sort the list by the time of day of their finish, this is done using Finish.ToD.Decimal sorted from largest to smallest.

Similarly we only want to show participants who have already finished, so we filter based on Finished which refers to the Finish Result. Again, we want to limit this list to only show 5 participants so the Maximum Number of Records is set to 5.

The fields are kept simple, however as we are looking at finishers we use Time and GenderRank which are both referencing the Finish Result.

To add some highlights to this list, we use dynamic formatting to change the colour of the text to green for participants where they are currently first in the GenderRank. This is applied using the more details for all fields so it applies to all columns.
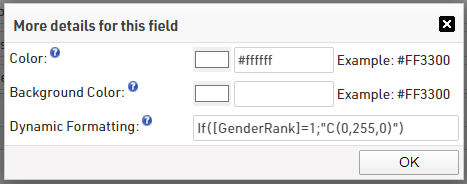
If([GenderRank]=1;"C(0,255,0)")
Again we have some additional settings and formatting which we will cover when looking at the display of data later on.
Current Time
Current time can be particularly useful for Time Trials so participants know how long they have till their start and can also get an idea how long riders have been on course.
This uses the ElapsedTime() function to display a running time since 0, which ultimately returns the current time of day. Note that the elapsedtime relies on the time zone of the event file and so may be inaccurate for you when previewing in this file.
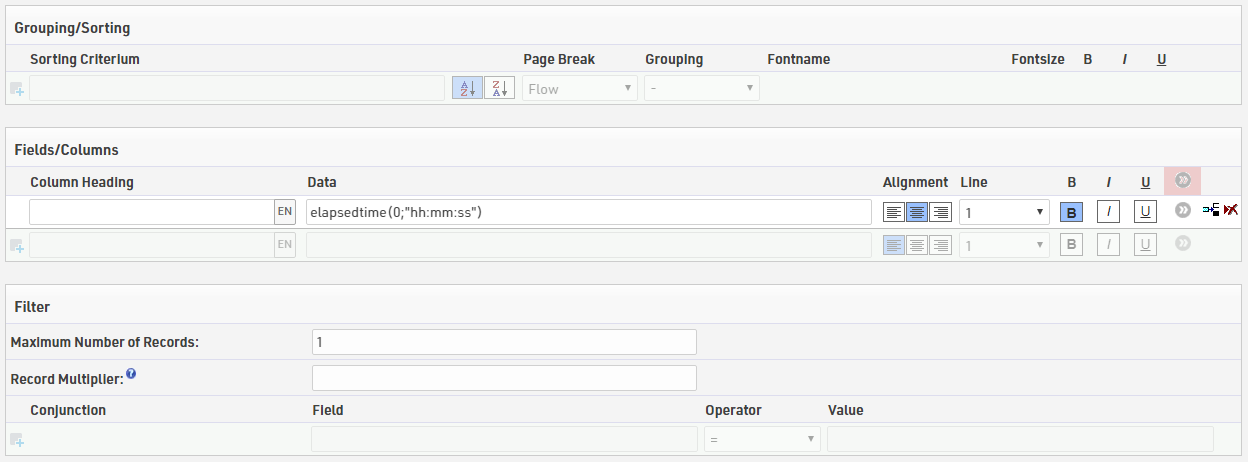
There is no grouping, sorting or filtering applied, but the Maximum Number of Records is set to 1, since we only need this returned once.
Presenter Configuration
The presenter is a powerful tool which can display multiple Output Lists together, as done in this example, or can be set to automatically or manually scroll through different Output Lists.
We set this up using the Remote Controlled Presenter 1 option from the dropdown, this ensures the settings are saved for you to preview, and could be controlled by a different computer if the display is already running.
When setting up the Presenter there are a number of settings to consider.
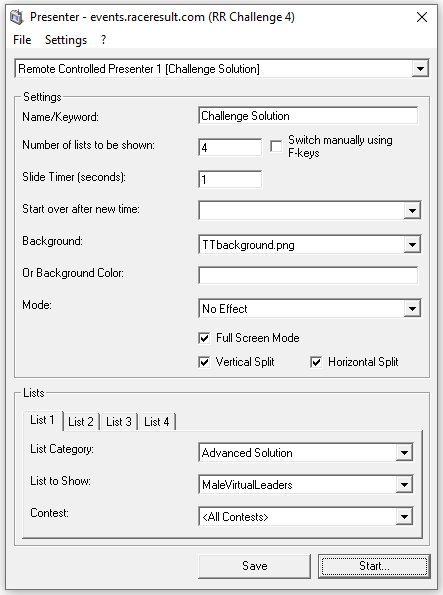
Key Settings
Number of lists to be shown - We are showing 4 different lists here.
Slide Timer - As we want to use the elapsedtime it is important that this is set to 1 second to ensure it updates normally.
Full Screen Mode - With this ticked there is no windows menu bar shown when running the display (recommended).
Vertical / Horizontal Split - This splits the display in to 2 or 4 regions splitting it down or across the middle, this allows either 2 or 4 Output Lists to be displayed simultaneously. For this we have both enabled.
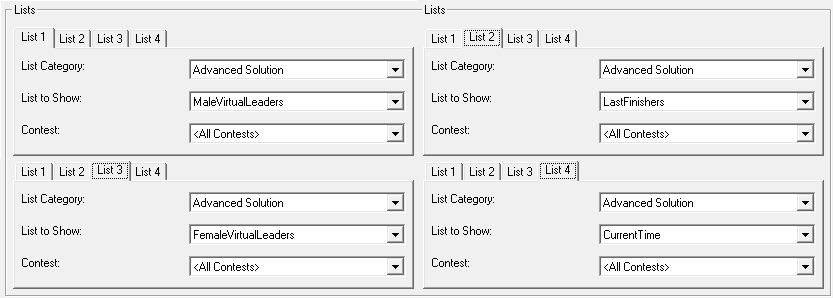
Lists - A new tab will be generated for each list according to the Number of lists to be shown. We need to select the relevant lists to be displayed, which will correlate to a different region of the display. They are arranged in the image below as they will be on the screen.
Formatting
Once the basic display and lists are configured, we can now apply some additional custom formatting to make the display stand out and to ensure it is more readable outdoors.
By default the display will look like the PDF version of the output on the screen with black text on a white background with some default headers and separator lines. Presenter uses the same output list page settings as used for PDFs to modify the display of data on the display.
Header / Footer - For each output we set a relevant Head Line 1, and removed Head Line 2 and any Footer Text. Here we can also control the font settings for the Head Line and Column Heads.
Head Line 1 is applied to all outputs and Column heads are only removed the for Current Time, this removes the separator line which is otherwise shown.


By removing the Footer Text it also removes the end line which is displayed at the bottom of the list normally.
Data Formatting - You can also adjust the size and spacing of the data to ensure it can be easily read. Within the page settings we set the font size and line spacing we want to use for our fields.

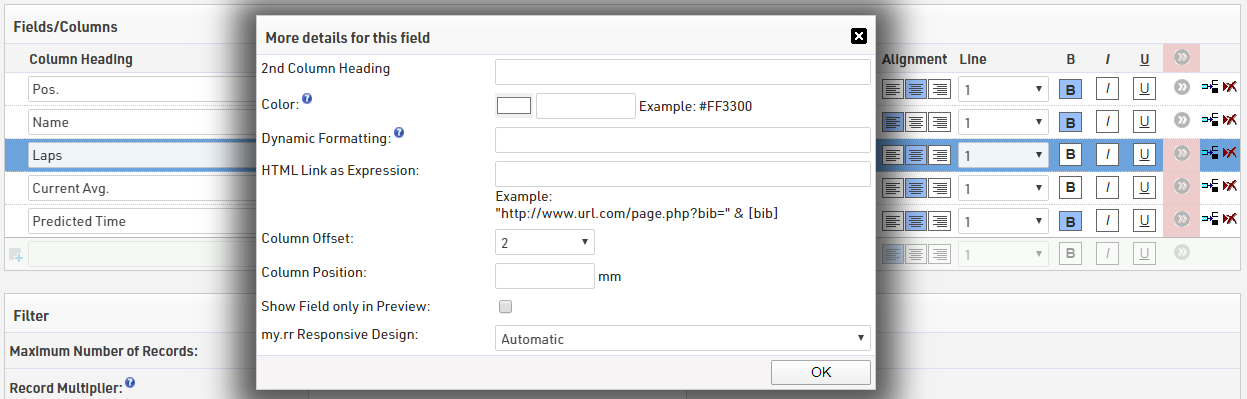
As the columns can still be somewhat close together we then also applied a column offset in the fields / columns setup for each output. For example in the Virtual Leaderboard outputs a column offset of 2 was applied to the Laps, Current Avg. and Predicted Time columns.
Alignment of Data - The position of the text on the display is controlled by the Page Margins settings in the Output Page settings. Normally you will set the Left and Top to control the position of the text in relation to these edges. Setting a value for Right and Bottom helps to set a maximum limit for the Output, this is particularly useful to limit the width of the separator line shown below the Column Heads

Background - Presenter can use either a background image or background colour, we created a simple background image which is first uploaded to the event file pictures.
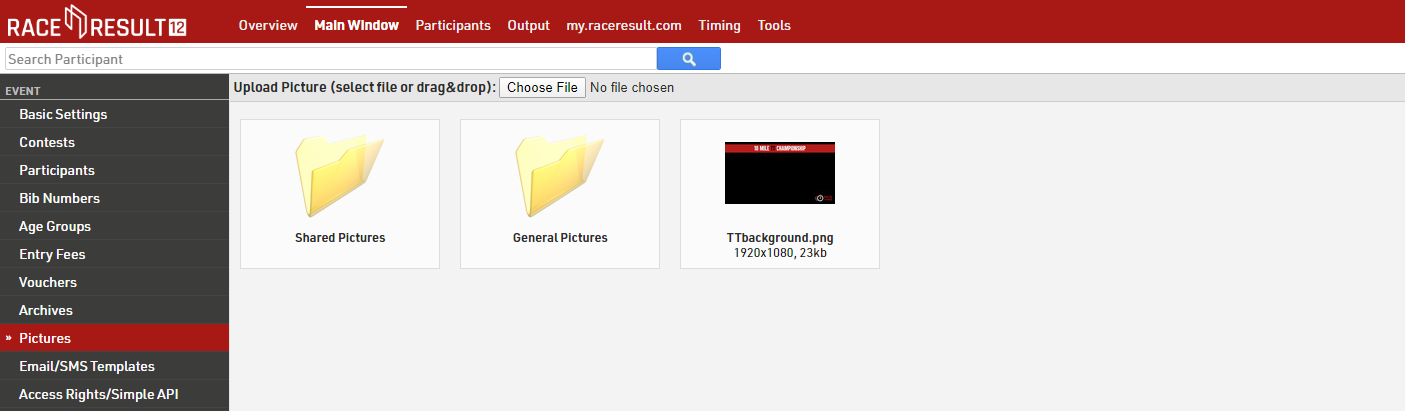
Once loaded you can select an image in the Presenter setup.

Once the background is applied you may need to consider some other settings again. For example, as our background is predominantly black we changed the font colour of text to white / red.
This is first applied to our data fields using the more details for all fields.
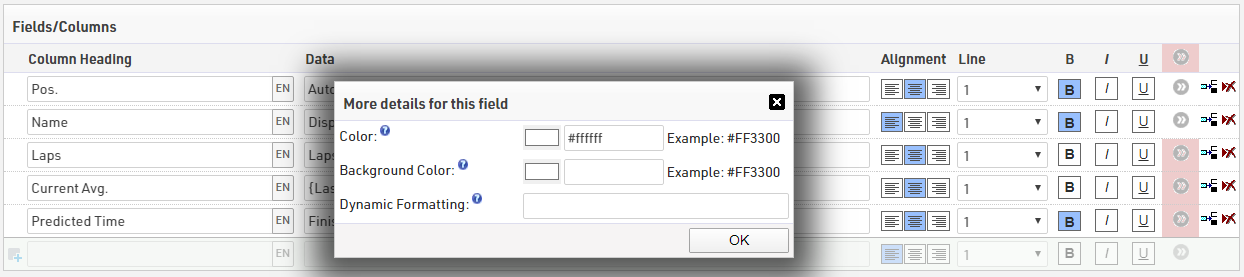
Next we also setup the Head Line 1 and Column Heads using the additional settings for those with the Head Line 1 set to red and Column heads in white
