Sotto Analisi troverai alcuni strumenti che sono utili per analizzare il tuo evento mentre è in corso; questi sono progettati per aiutarti a programmare il file evento, identificando eventuali dati errati, spesso causati da errori dei partecipanti.
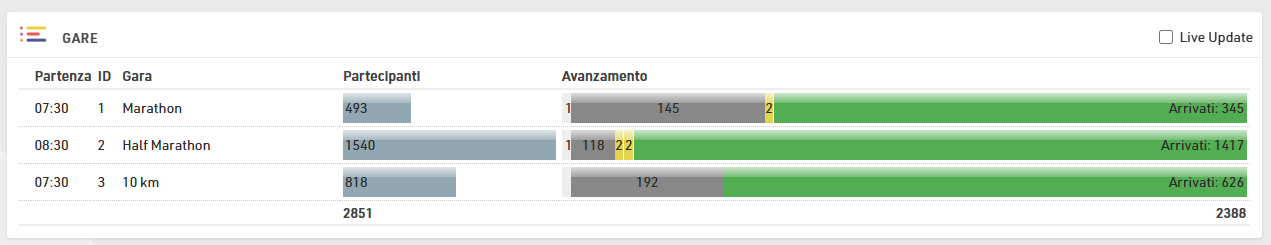
Panoramica della Gara
Questo fornisce una panoramica di ogni **contest**, mostrando il numero di partecipanti iscritti, partiti / in gara e arrivati al traguardo per ciascun contest. Passando il mouse su uno dei segmenti viene mostrato anche il dettaglio per genere. Accanto a ogni contest è inoltre visibile un **orologio in tempo reale** che mostra il tempo trascorso dal T0.
Visualizzazione Tempo
La Visualizzazione Tempo è uno strumento molto utile per verificare se i partecipanti hanno mancate letture o se i tempi risultano realistici, in altre parole per identificare potenziali errori nei dati.
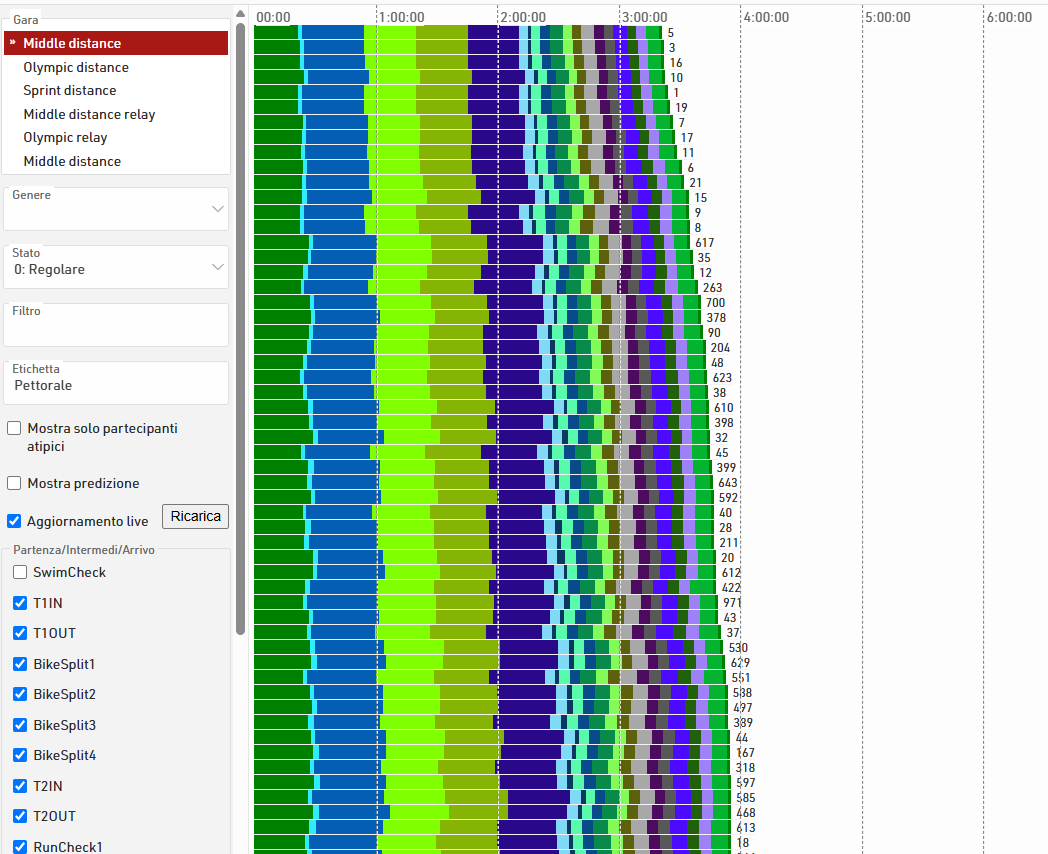
Lo strumento mostra una riga per ciascun partecipante. I diversi colori rappresentano i tempi di sezione tra due intermedi, mentre la lunghezza della barra rappresenta il tempo. Gli atleti più veloci vengono visualizzati in cima.
Cliccando su una riga si apre un popup con i dettagli completi di quel partecipante, dove è anche possibile modificarne lo stato.

Utilizza la barra delle impostazioni a sinistra per selezionare Gara, Genere, Stato o applicare altri filtri; dovresti anche selezionare gli intermedi o i risultati che faranno parte della visualizzazione. A volte può essere utile escludere determinati tempi: di solito si preferisce visualizzare solo i dati di cronometraggio principali di ciascun Punto di cronometraggio e non i tempi intermedi.
È possibile applicare un’etichetta a ciascuna riga, utile quando si confrontano più gare insieme.
Se vuoi vedere solo i partecipanti con dati mancanti, clicca su “Mostra solo partecipanti atipici”; la vista include anche l’opzione Aggiornamento Live, che aggiorna automaticamente la visualizzazione man mano che vengono calcolati nuovi risultati. Questa funzione è particolarmente utile per monitorare una gara mentre è in corso.
Tasso Lettura
Il Tasso lettura offre un’analisi aggiuntiva degli Intermedi, per confrontare i tassi di rilevamento tra i punti di cronometraggio primari e di backup, considerando anche eventuali inserimenti manuali di dati grezzi.
Per ciascuno viene calcolato il numero atteso di partecipanti, basato sul numero di arrivati (se è selezionata l’opzione Solo Arrivati) oppure sul numero di partecipanti rilevati a questo Intermedio o a uno successivo. Questo valore viene poi utilizzato per calcolare la percentuale di partecipanti rilevati al punto di cronometraggio principale, la percentuale al punto di backup, la percentuale combinata tra i due, il numero di letture manuali e il totale dei partecipanti rilevati in quel punto complessivamente.
Per ogni Gara viene generata una tabella indipendente, mentre in fondo alla tabella viene mostrato anche il tasso totale di rilevamento su tutti gli Intermedi.
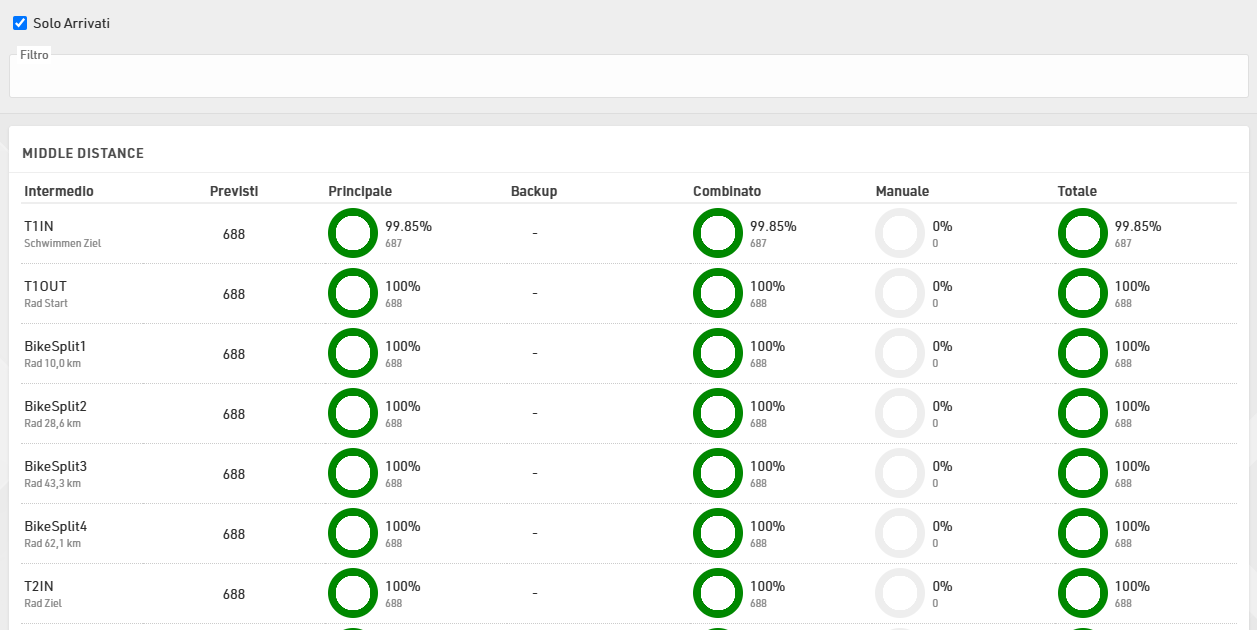
È inoltre possibile applicare un filtro opzionale aggiuntivo.
Tempo di partenza vs. Gara
Tempo di partenza vs. Gara è uno strumento molto utile per trovare partecipanti che hanno corso in una gara diversa da quella per cui si sono registrati. In particolare quando si utilizza la modalità dei dati grezzi, questi potrebbero non avere alcun risultato perché tutti i loro rilevamenti non vengono elaborati a causa della gara sbagliata a cui sono iscritti. Di conseguenza sarebbe difficile senza questo strumento trovare questi partecipanti.
Presupposti
Considerare i seguenti presupposti affinché lo strumento funzioni:
- al momento funziona solo con risultati avanzati;
- il cronometraggio si sta svolgendo con tempo impostato su ora solare;
- i tempi di partenza vengono mantenuti;
- il risultato che contiene l'ora di inizio è selezionato come risultato iniziale nelle Impostazioni di gara
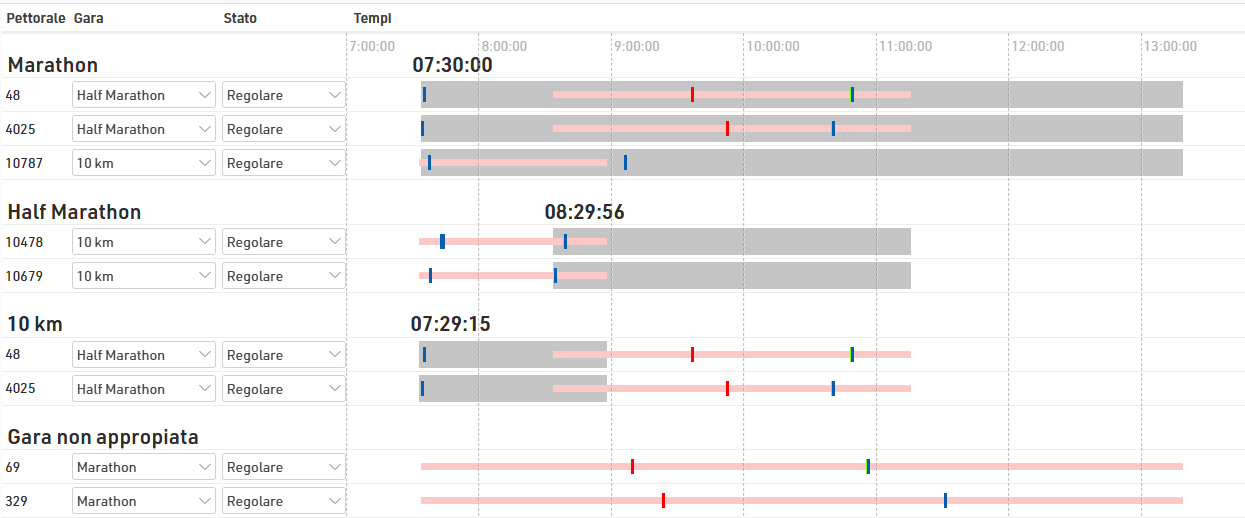
Cosa puoi vedere
- Sotto il titolo di ogni gara vengono elencati tutti quei partecipanti che non rientrano nella gara per la quale si sono registrati, ma che invece rispettano i criteri della gara in oggetto;
- L'area con il colore di sfondo grigio mostra l'intervallo di tempo necessario alla maggior parte dei partecipanti per completare la gara;
- La barra rossa, al contrario, mostra l'intervallo di tempo della gara per il quale il partecipante è registrato;
- Le linee verticali mostrano le letture dei chip dei partecipanti. La legenda nella parte inferiore dello schermo mostra quale colore appartiene a quale punto di cronometraggio;
- Se ci sono molte letture dello stesso chip con solo piccole lacune nel mezzo, le letture possono apparire come una barra.
Apportare modifiche
È possibile modificare la gara del partecipante o modificare il suo stato (ad esempio in DSQ). Quando si fa clic sul numero di pettorale, la finestra dei partecipanti viene visualizzata sul lato destro dello schermo ed è possibile controllare in dettaglio i dati non elaborati prima di apportare modifiche.
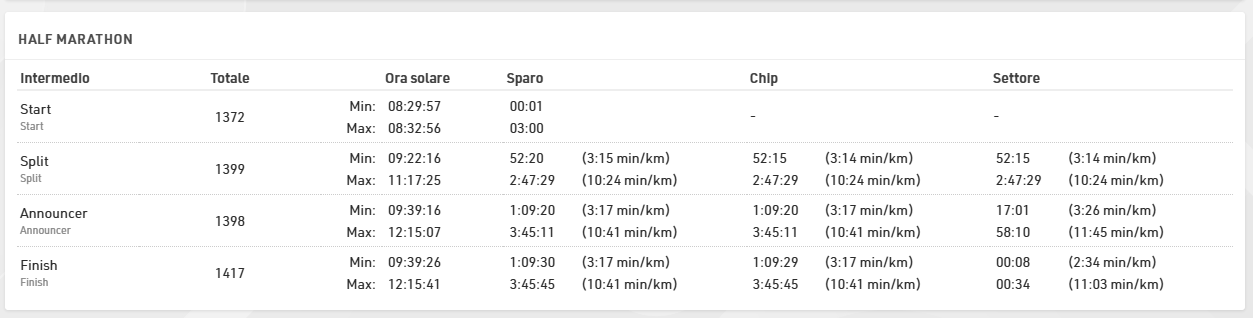
Analisi Intermedi
L’analisi Intermedi fornisce un dettaglio dei tempi più veloci e più lenti per ciascun intermedio, utile per verificare che la configurazione degli intermedi sia corretta.