These solutions focus on using a variety of methods for calculations, and displays, thinking about which functions we can use. The solutions feature the final calculation at each step in building it up, but of course in the final application this could be simplied.
Change in Ranks
This task is designed to be used for live leaderboards to help show the change in ranks for participants.
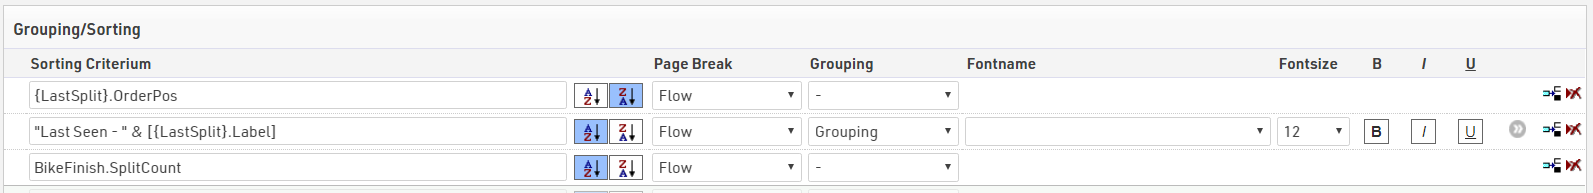
The Output is sorted and grouped similar to a Live output list.
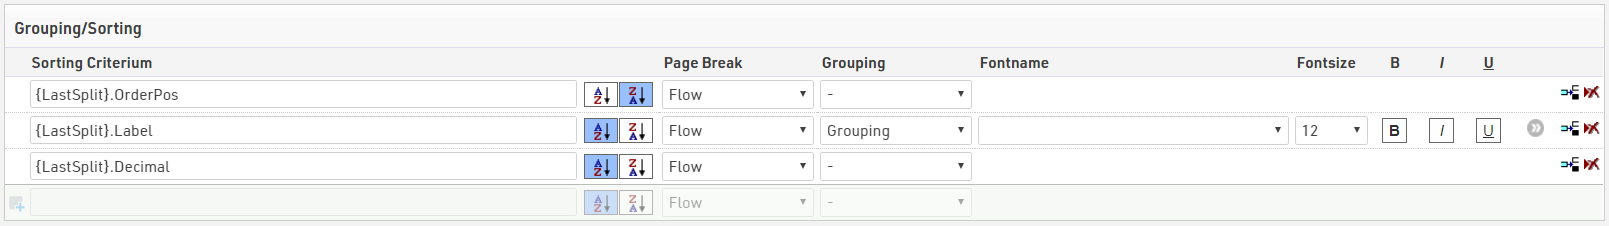
First sorted by {LastSplit}.OrderPos from largest to smallest, grouped by {LastSplit}.Label to show the last split they were seen at and finally sorted by {LastSplit}.DecimalI.
For the change in ranks there are 2 fields we need to consider, their current rank and the previous rank.
For the current rank we use {LastSplit}.Overall
Previous Split data can be accessed using the .Prev Dot Logic. Here we use {LastSplit}.Prev.OverallI
The same could be applied using the Gender or AgeGroup ranks.
For the calculation we subtract the current rank from the previous rank
[{LastSplit}.Prev.Overall]-[{LastSplit}.Overall]
In this way if a participant's rank improves then the value is shown as positive, and if they lose places it is negative. You may prefer to show these the opposite way round, to do this you could reverse the rank fields in the calculation.
The final step is to format this, there are 2 considerations to make, how to differentiate between positive and negative changes and what to show if their rank does not change (change = 0).
For the display of this change we include the calculation in an IF statement
If([{LastSplit}.Prev.Overall]-[{LastSplit}.Overall]=0;"-";format([{LastSplit}.Prev.Overall]-[{LastSplit}.Overall];"+s"))
First, if the change is equal to 0 then we display "-" in place of the value, which is cleaner in Outputs. Secondly we use format() to format the number as "+s" this will now show a plus or minus sign for all values whether positive or negative.
The final part is using Dynamic Formatting to show positive changes in green, negative changes in red and no change to remain black.
Since we have 3 options we use a switch()
Switch([{LastSplit}.Prev.Overall]-[{LastSplit}.Overall]>0;"C(0,255,0)";[{LastSplit}.Prev.Overall]-[{LastSplit}.Overall]<0;"C(255,0,0)")
This colours values larger than 0 in green, values smaller than 0 in red and for values which are equal to 0 they will fall back to the default colour which is black.

Closest to Run Average
Whilst slightly obscure, this task has multiple steps in order to reach the final result which require you to think about how data is handled. This solution outlines each step in order to reach the final result.
To calculate the average we need to use the DAvg() function which looks at a particular field for all participants who meet a filter.
To find the average we need to use each participants Run leg time as a deciamal value using Run.Decimal.
DAvg("[Run.Decimal]";.....)
When using D Functions the fields and filters must both be wrapped in quote marks.
For the filter we need to consider which participants we want to compare to, we need to consider only participants who have finished the run, and those of the same Contest and Gender.
When we want to compare fields in a filter to only consider participants with the same value we have to escape quotes around the field, for example:
[Contest]=""" & [Contest] & """
The same as our field, the whole filter must then be wrapped in quote marks. The full DAvg expression is as follows
DAvg("[Run.Decimal]";"[Run.TimePositive]=1 AND [Contest]="""&[Contest]&""" AND [Gender]="""&[Gender]&"""")
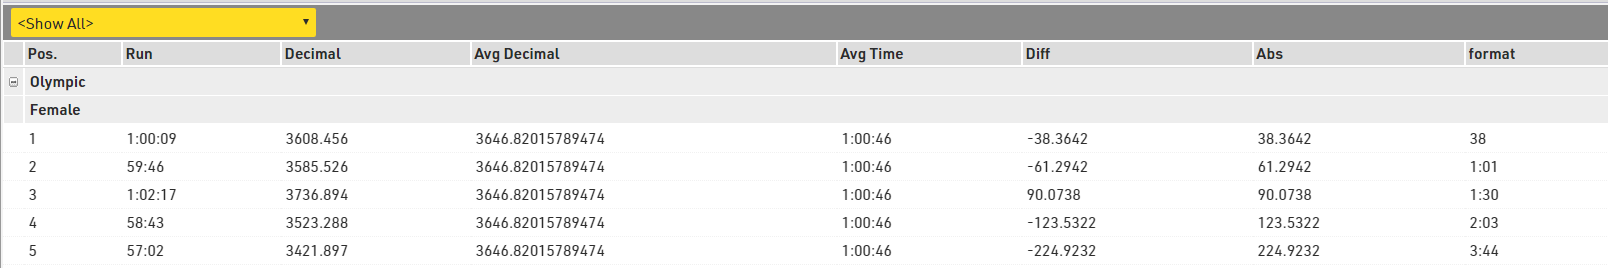
This returns the average Run time for each gender as a decimal value. We then also used format() to display this as a regular time in the Time Format "HH:mm:ss".
The difference from the average is calculated for each participant by subtracting the average time as a decimal from Run.Decimal.
[Run.Decimal]-DAvg("[Run.Decimal]";"[Run.TimePositive]=1 AND [Contest]="""&[Contest]&""" AND [Gender]="""&[Gender]&"""")
The values returned provide the difference from the average, however these differences may be both positive and negative, if the list was sorted by this then the lowest (most negative) value would be returned first. To sort this correctly we need to ignore whether times are positive or negative, this is done using the abs() function.
abs([Run.Decimal]-DAvg("[Run.Decimal]";"[Run.TimePositive]=1 AND [Contest]="""&[Contest]&""" AND [Gender]="""&[Gender]&""""))
The time is then finally formatted as "HH:MM:Ss" which shows the relevant units only, the final expression to display the difference is written as
format(abs([Run.Decimal]-DAvg("[Run.Decimal]";"[Run.TimePositive]=1 AND [Contest]="""&[Contest]&""" AND [Gender]="""&[Gender]&""""));"HH:MM:Ss")
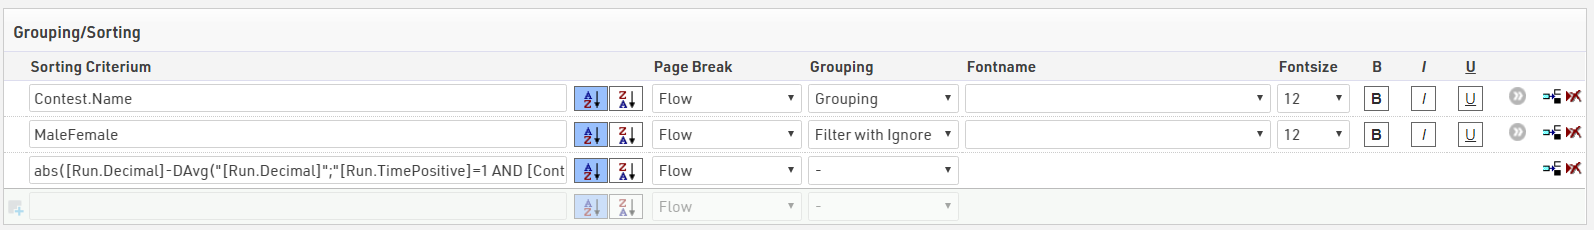
The output list is simply grouped by Contest.Name and then set to Filter with Ignore on MaleFemale, the sorting is based on the absolute value of the difference which we already calculated.
To rank participants we use AutoRank, which considers the Output grouping and sorting to rank participants. We don't create a rank for this as the aggregation functions are not fast and put heavy load on the server. By only calling the fields directly in the Output then they are only calculated when the Output is loaded.
Legs as Percentages
This task thinks about different ways in which we can use the data already in a file to give participants more information with an example of how this could be displayed.
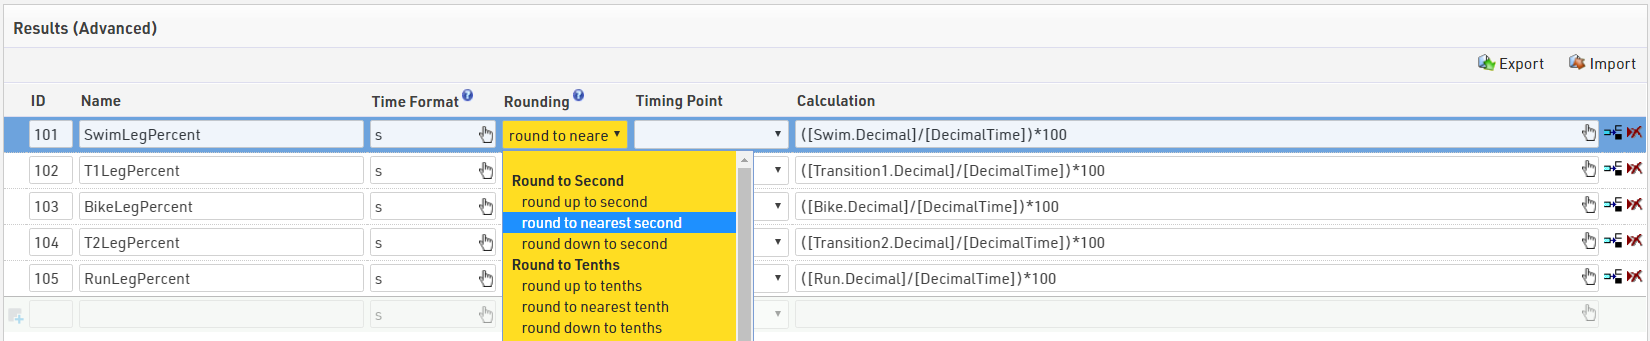
The calculation of the percentage uses each leg time as a decimal, which is divided by the DecimalTime, which refers to the Finish Result. For example:
([Swim.Decimal]/[DecimalTime])*100
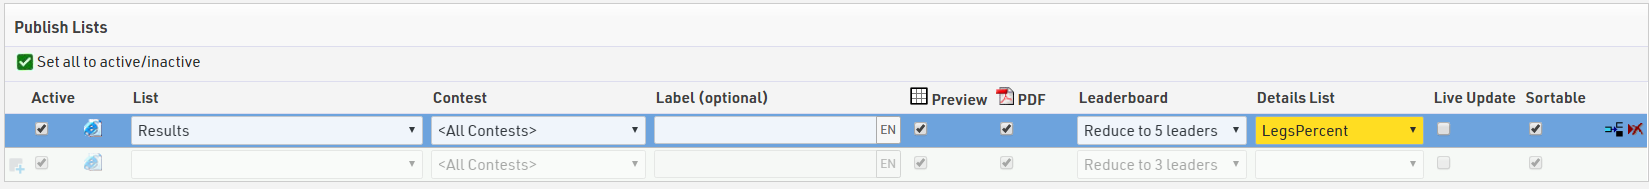
For displaying this data we only want to consider each percent as a whole number, to make this easier, each percentage is written in to an Advanced Result. Each Result is formatted as just "s" so a whole number is returned, the Results setup also allows us round each percent to the nearest second.
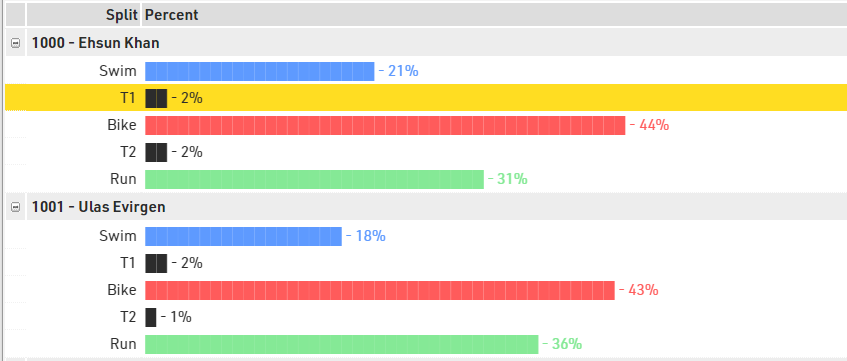
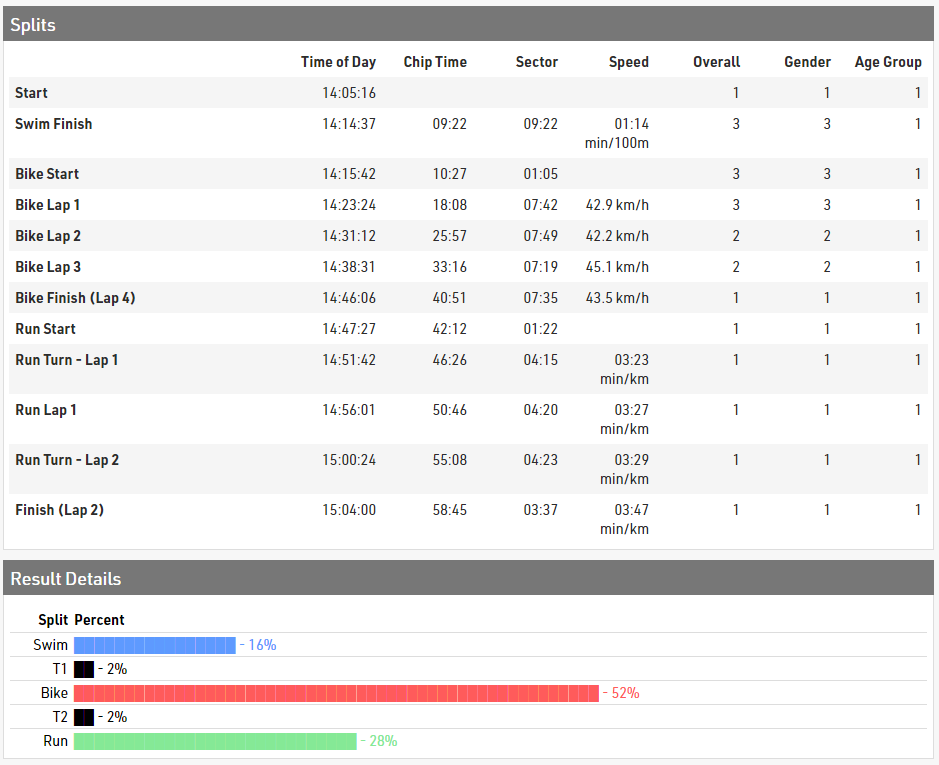
We wanted to display this with some visual representation, this was setup so it could be displayed as a details list on the my.raceresult results page.
We used a Multi-Line List, with one line for each leg.
Each line has the leg name which is entered as text, aligned to the right, next to this we wanted to a show a bar for each leg corresponding to the percentage of the total time.
To do this we used the string() function which repeats characters by a defined number. The character used is the special character █ (which can be typed by pressing Alt + 219 on Windows), the number is the percentage calculated for each leg.
String([SwimLegPercent];"█")
Next to this we also show each percentage for each leg.
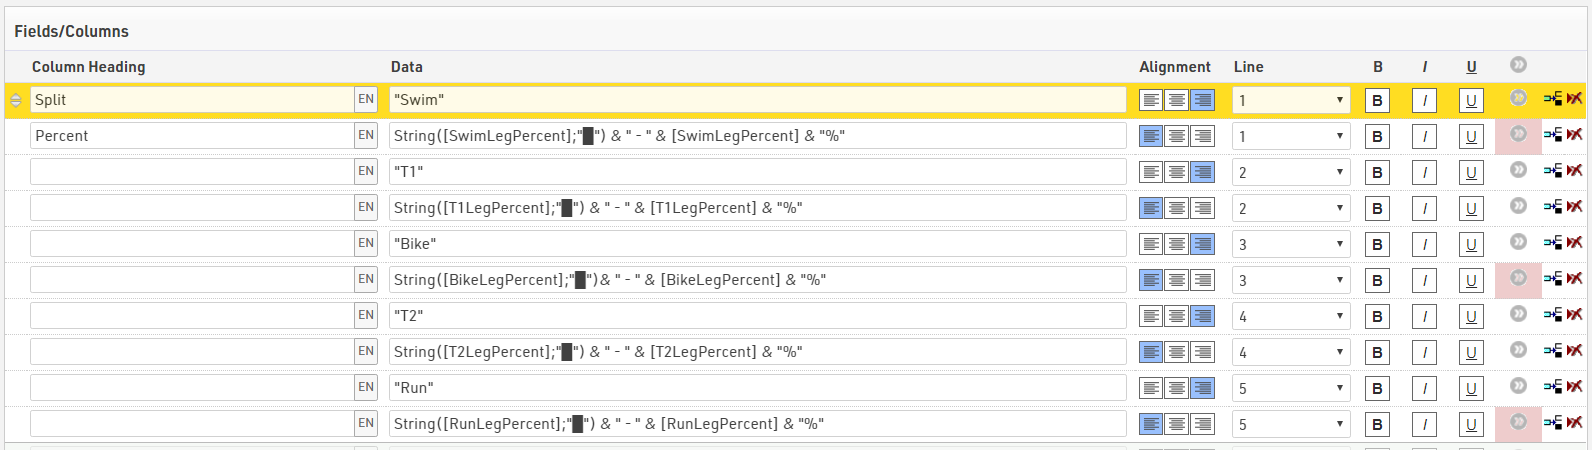
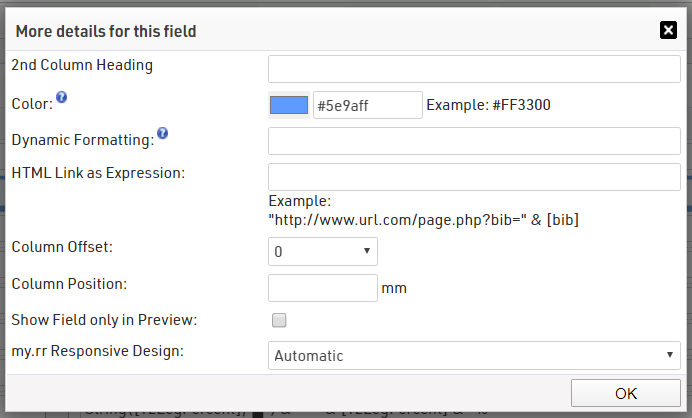
We also colour each bar a different colour.
In output list we grouped the fields by Bib and Name to make it clearer, although to show this in a details list would not be necessary.
This can be selected as a detailed results list on my.raceresult
Short Bike Laps
This task is useful for checking participants still on course and those who may not have completed the right number of laps on a particular part of the course.
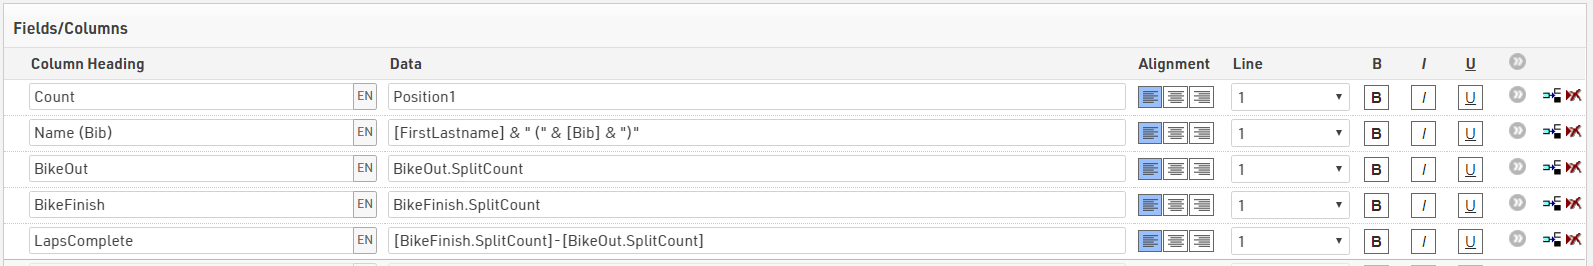
To calculate the number of laps completed from our Splits we use the .SplitCount field, this counts the number of Splits which have a calculated time up to and including the specified Split.
The 2 Splits we need to consider are BikeOut, the start of the bike leg and BikeFinish which is the end of the last lap.
By calculating the difference between these 2 Splits we can calculate the number of laps which have been completed.
[BikeFinish.SplitCount]-[BikeOut.SplitCount]
For participants with all Splits up to BikeOut, then BikeOut.SplitCount will return 3
For participants with all laps completed up to BikeFinish then BikeFinish.SplitCountwill return 10
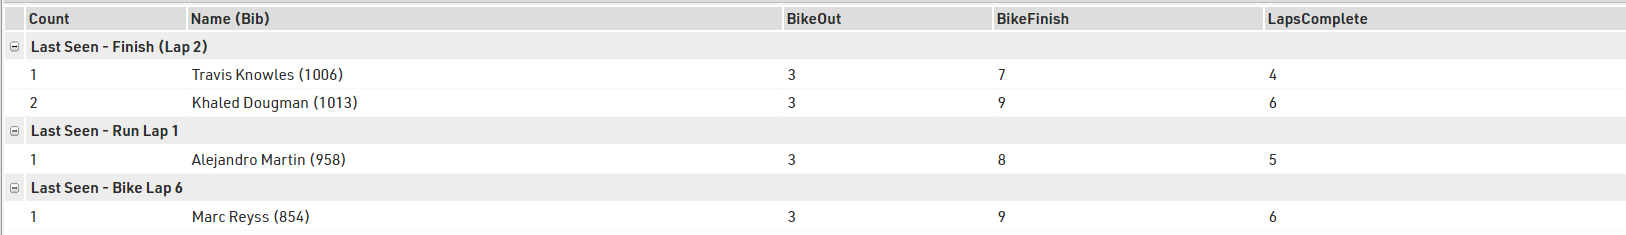
To find participants who have not completed all 7 laps we filter the Output list by those who have passed BikeOut already and who's SplitCount difference is less than 7.

The output is then sorted and grouped according to participants last split, first sorted by {LastSplit}.OrderPos from largest to smallest, so those further on the course will show at the top of the list, and grouped by {LastSplit}.Label. Within each group participants are sorted by BikeFinish.SplitCount so those with fewer laps completed are flagged first.
For each participant we show primarily the name, bib and lapscompleted using our calculation. We also use Position1 which gives a count of the number of participants in each group. This allows for a quick count of the number of participants still on course.
Split Speed
Speed can be useful in both km/h, the Split field .SpeedOrPace will return the speed or pace for a split or leg according to the default unit for the type of sport and the units of measurement in the Event file, it also returns the unit as part of the field.
This file is set to use Metric units so all cycling speed is returned as km/h.
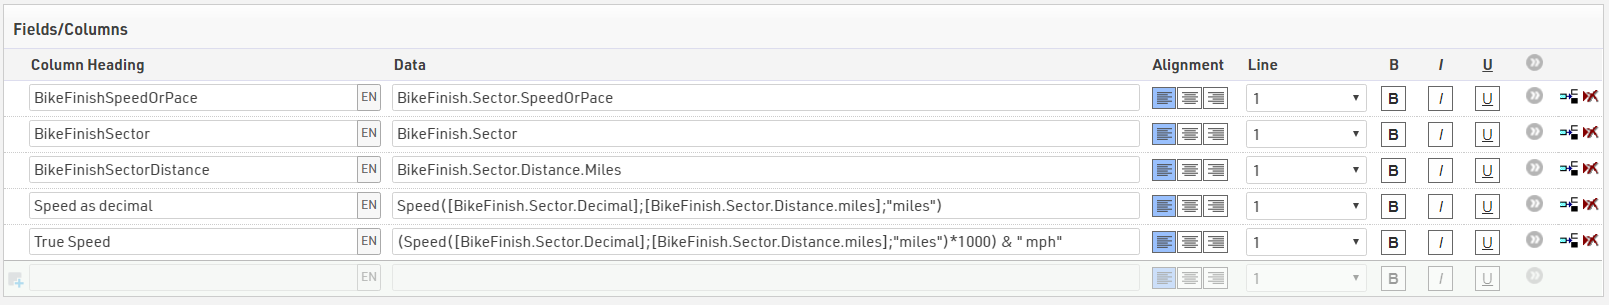
To get the speed for bike lap 7, we need to use the BikeFinish sector, since BikeFinish.SpeedOrPace would return the average speed from the start, we therefore use BikeFinish.Sector.SpeedOrPace for km/h.
To calculate speed in mph we can use speed(), this uses 3 parameters, time, distance and unit of distance.
Our time will use BikeFinish.Sector
For the distance we can call the sector distance, by default this is returned as a value in meters, but we can also call this in miles using BikeFinish.Sector.Distance.Miles.
Our Speed() function uses each of these and the unit as "miles".
Speed([BikeFinish.Sector.Decimal];[BikeFinish.Sector.Distance.miles];"miles")
Note: In versions of RACE RESULT up to 12.1.2 there is an error with the speed calculation in miles, where the value is wrong by a factor of 1000 so may require additional calculation to return the correct speed value.
We additionally have to append the unit of speed as text to this, since this is just a numerical value.

Swim Time Percentage
This Output accesses data of other participants, showing different ways that could be achieved.
The first thing we need to calculate the percentage is the Swim Time of the Gender winner, this could be called with 3 different fields and must be returned as a Deimcal value for our percentage calculation.
Finish.Gender.Top.Swim - This uses the Gender Split rank at the Finish Split, and returns the Swim time of the top participant of the same Contest and Gender.
Rank2.Top.Swim / GenderRank.Top.Swim - Uses the GenderRank setup in our Rankings, and returns the Swim time of the top participant in the same group.
DFirst("[Swim]";"[GenderRank]=1 AND [Gender]="""&[Gender]&"""") - Uses the Aggregate function DFirst() to return the Swim time of the first person who meets the filter. Here we filter by GenderRank = 1 and the Gender must be the same as the participant we are looking at. The double escape of quotes is also used in the Closest to Run Average solution. This filter does not consider Contest but could be expanded in the same way.
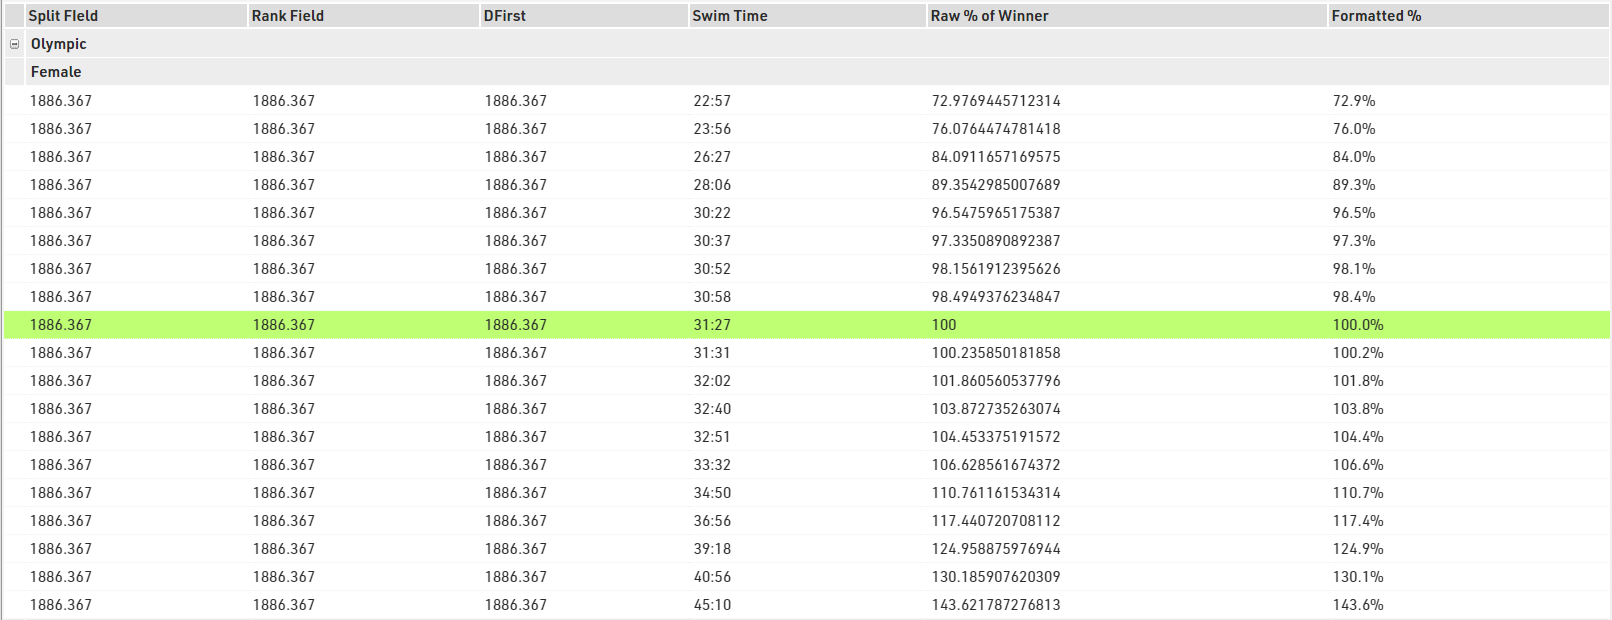
Percentage for each participant is calculated by dividing their Swim time as a decimal by the average we have already called, we used the Split Rank method for this, and multiplied by 100.
The result of this is formatted as "s.k" since the value is returned with up to 12 decimal places otherwise.
format(([Swim.Decimal]/[Finish.Gender.Top.Swim.Decimal])*100;"s.k") & "%"
Within the Output we Group by both Contest.Name and MaleFemale then sort by the value of the division of Swim time and Winner's Swim time.
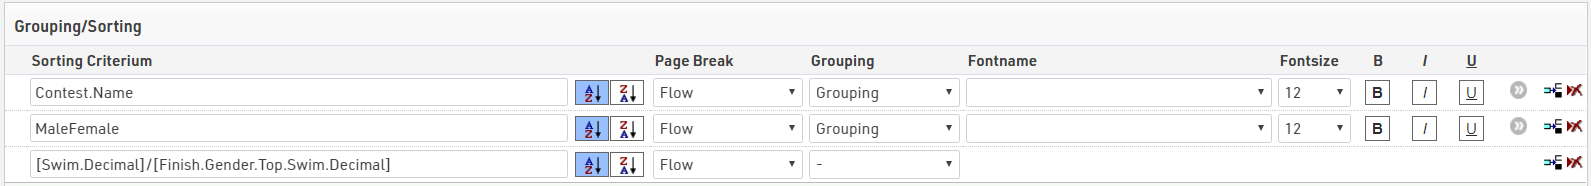
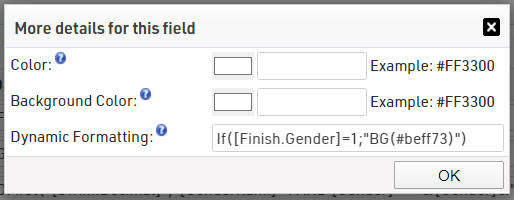
To make it clearer in the display we also highlight the winner in green, this is done using the additional details for all fields and dynamic formatting, setting the background where Finish.Gender = 1.