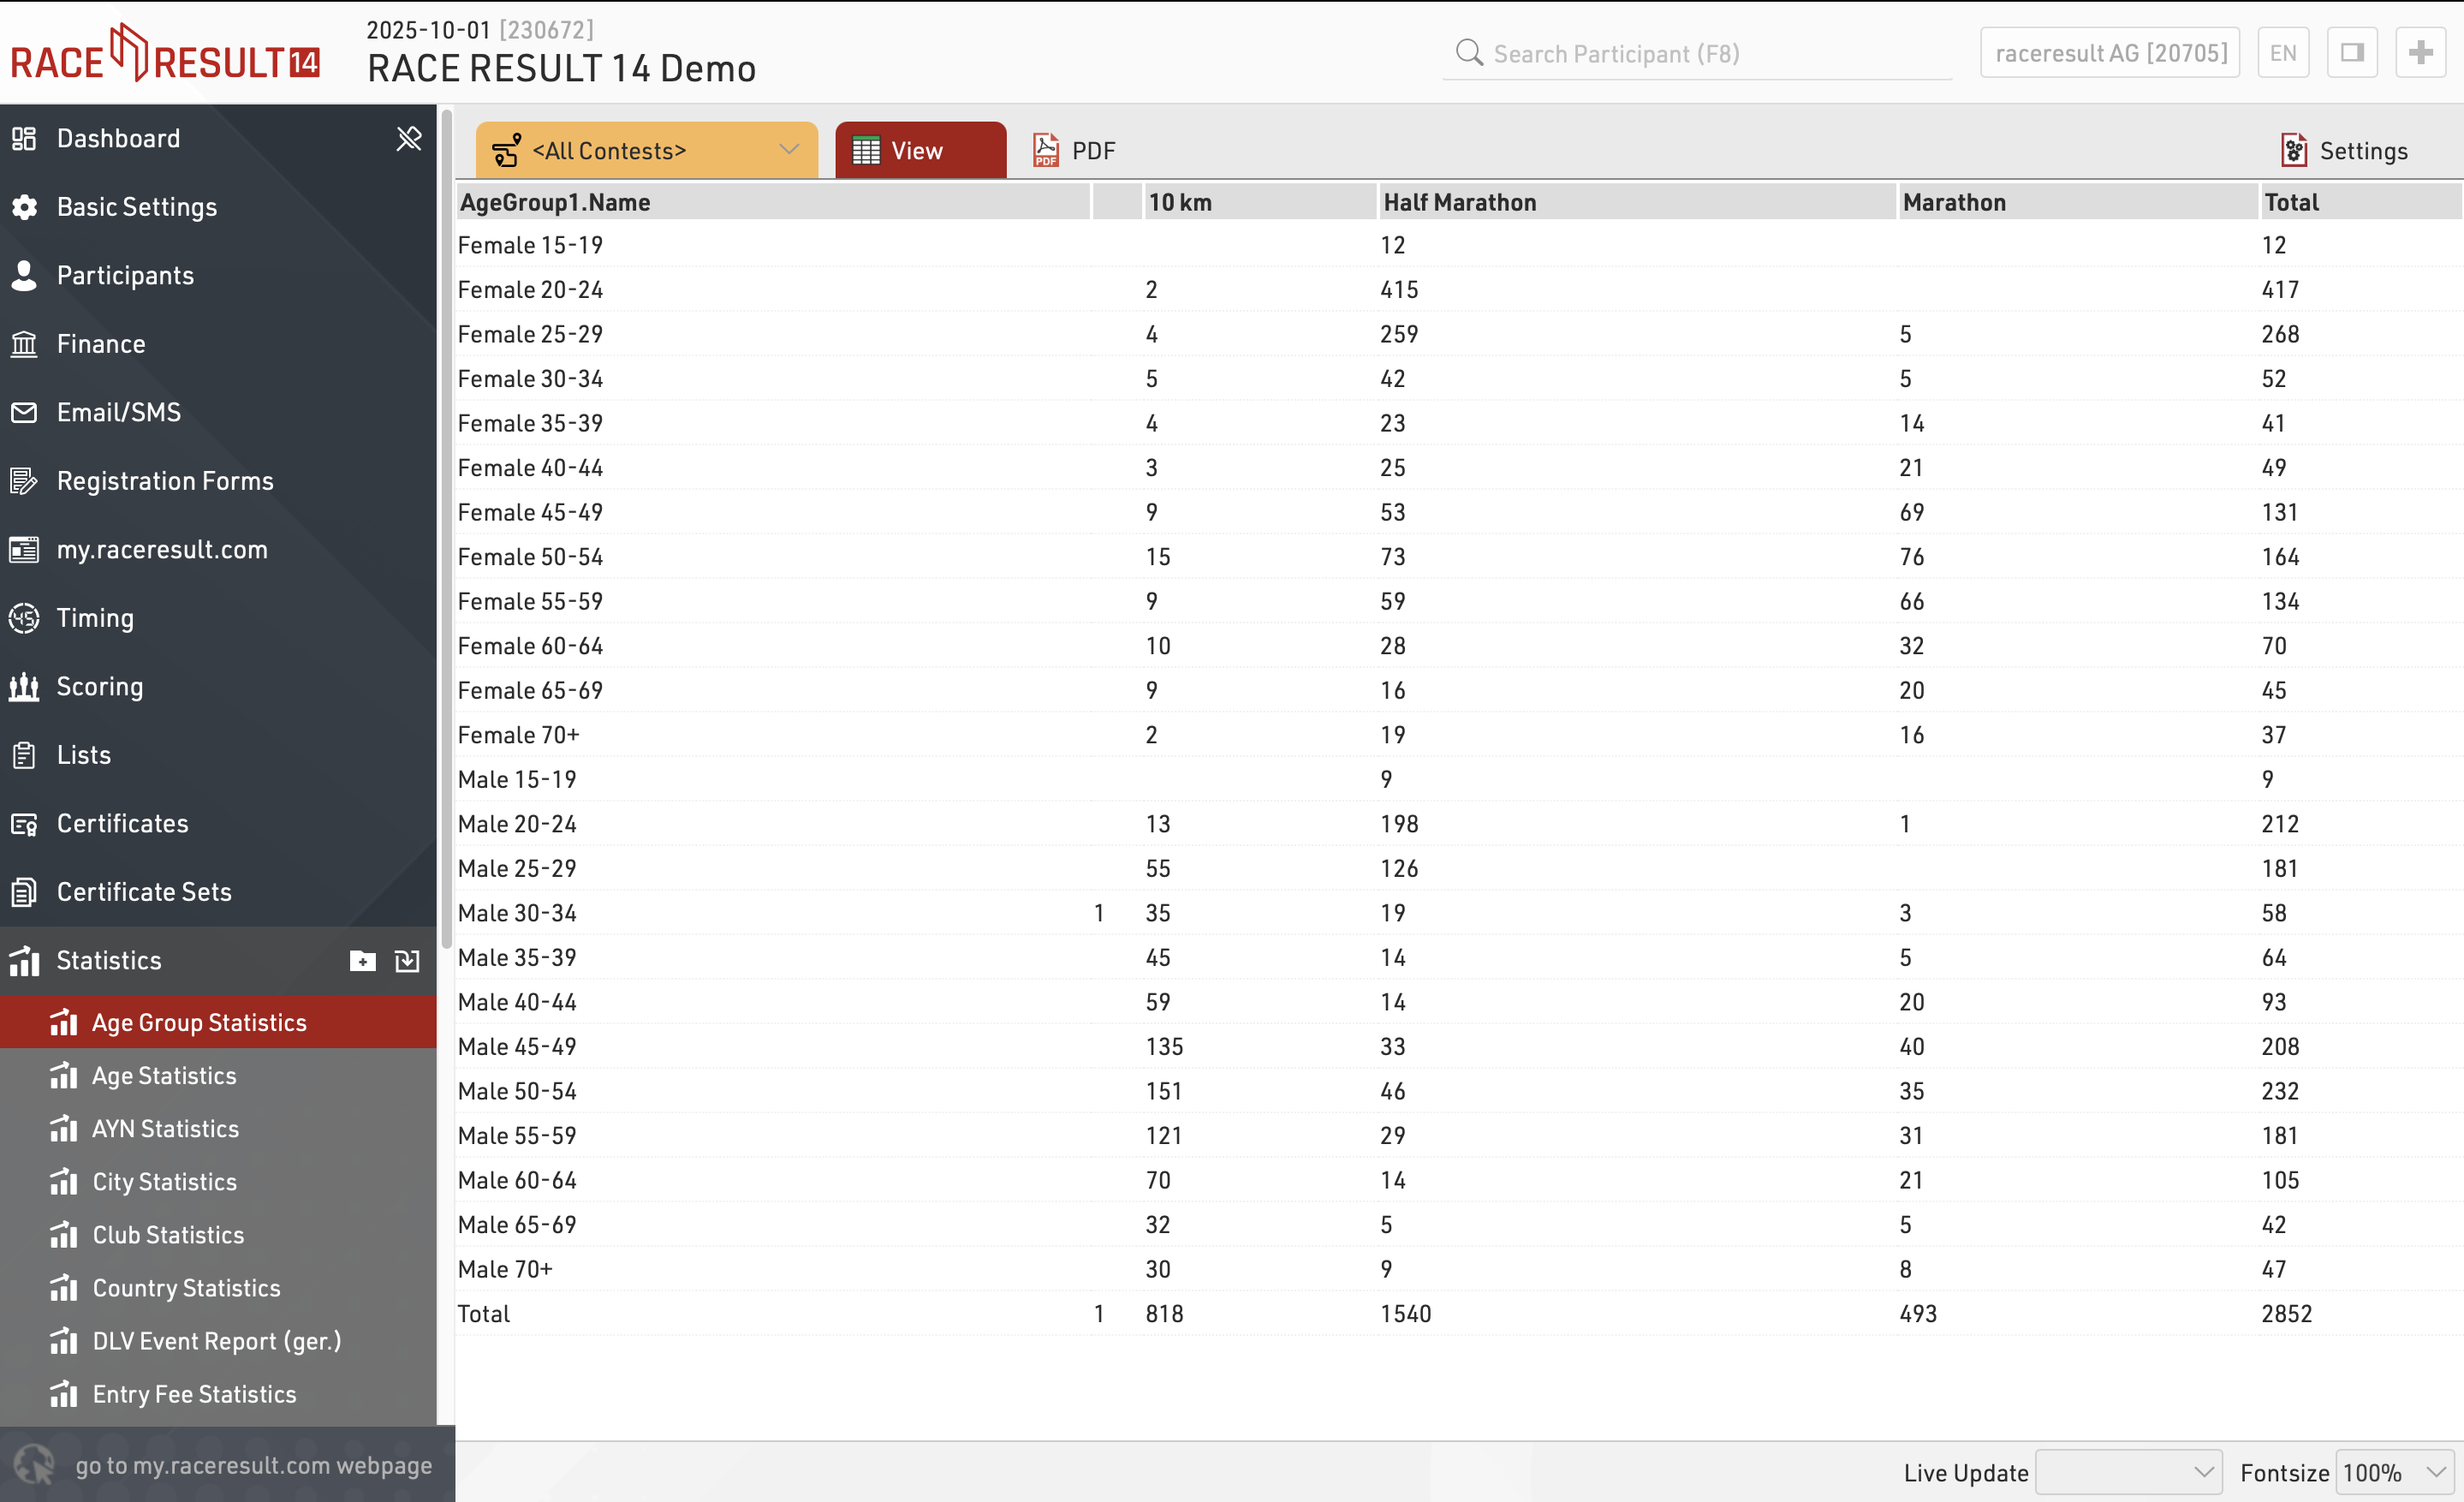
Statistics can create tables of statistical data either with custom rows/columns or using some of the pre-defined templates.
The list on the left shows all statistics tables in your event file which can be rearranged using drag&drop by clicking the free space to the left of the statistics name.
Statistics can be further sorted into folders, to create a new folder, click the Add Folder icon in the Statistics Header. By clicking the folder header, the folder can be expanded / collapsed, to sort the items within a folder alphabetically, click the  icon. Empty folders will be deleted automatically when you reload the window.
Clicking the name of a statistic from the menu opens an overview page for that list.
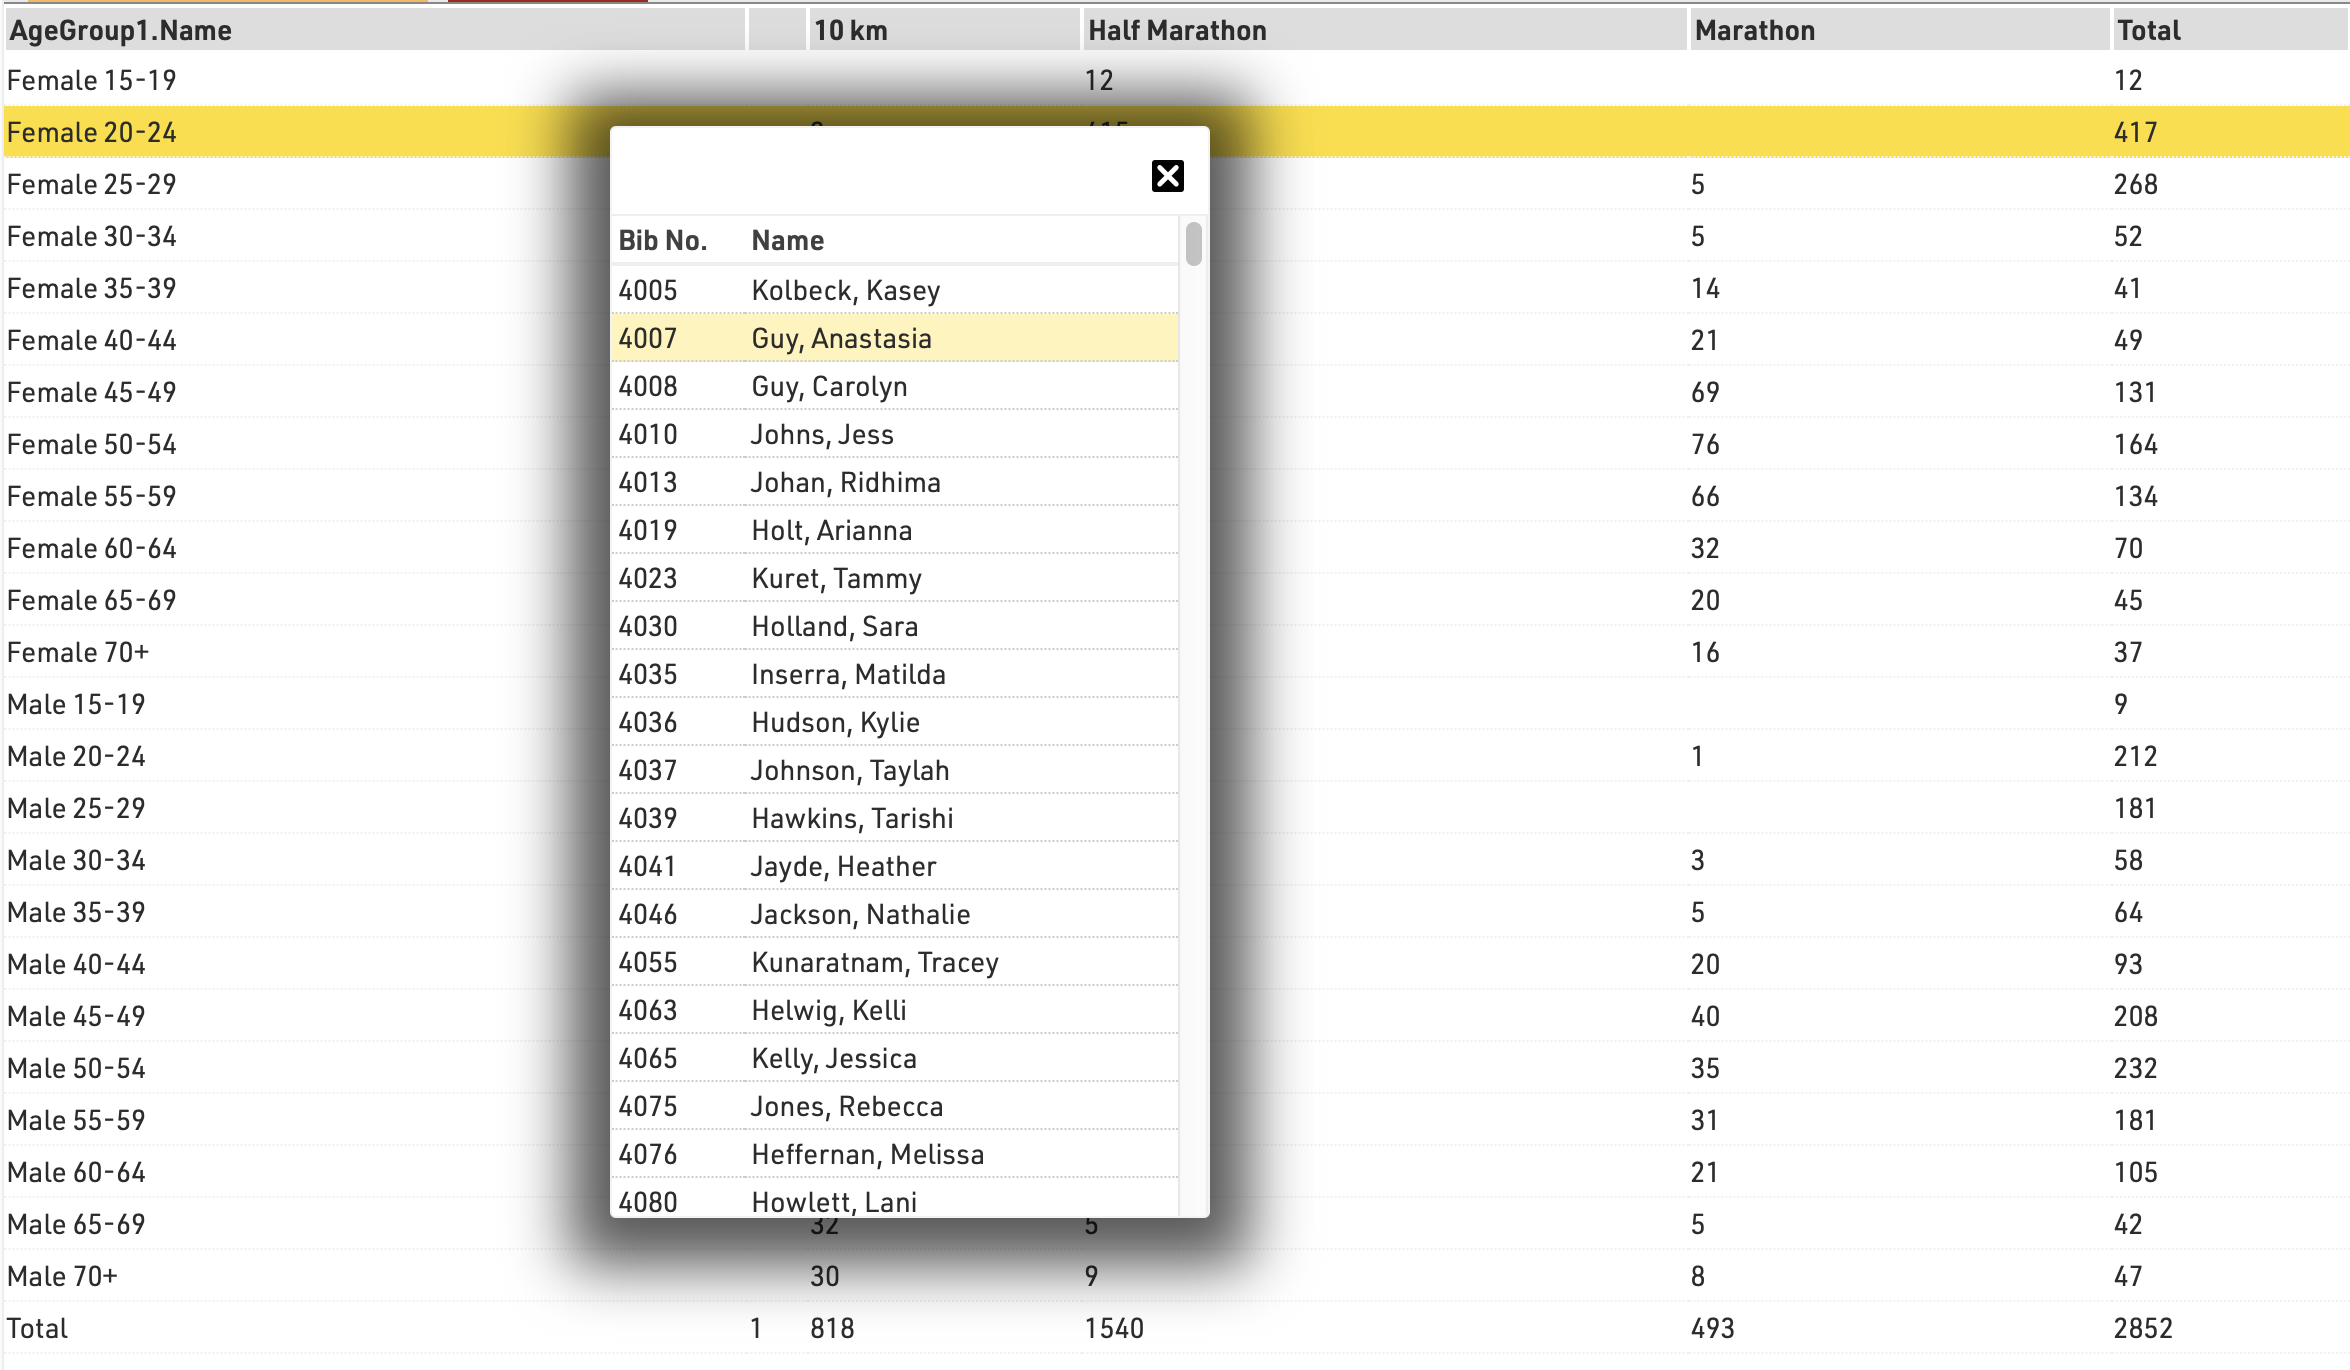
When viewing statistics, clicking on a value in the table will open a popup window with a breakdown of the participants considered in that item, clicking a participant will open that participant's details in the right-side window.
Create new type of statistics
You can easily create a new type of statistics. The most relevant settings are Rows, Columns, Field, and Mode.
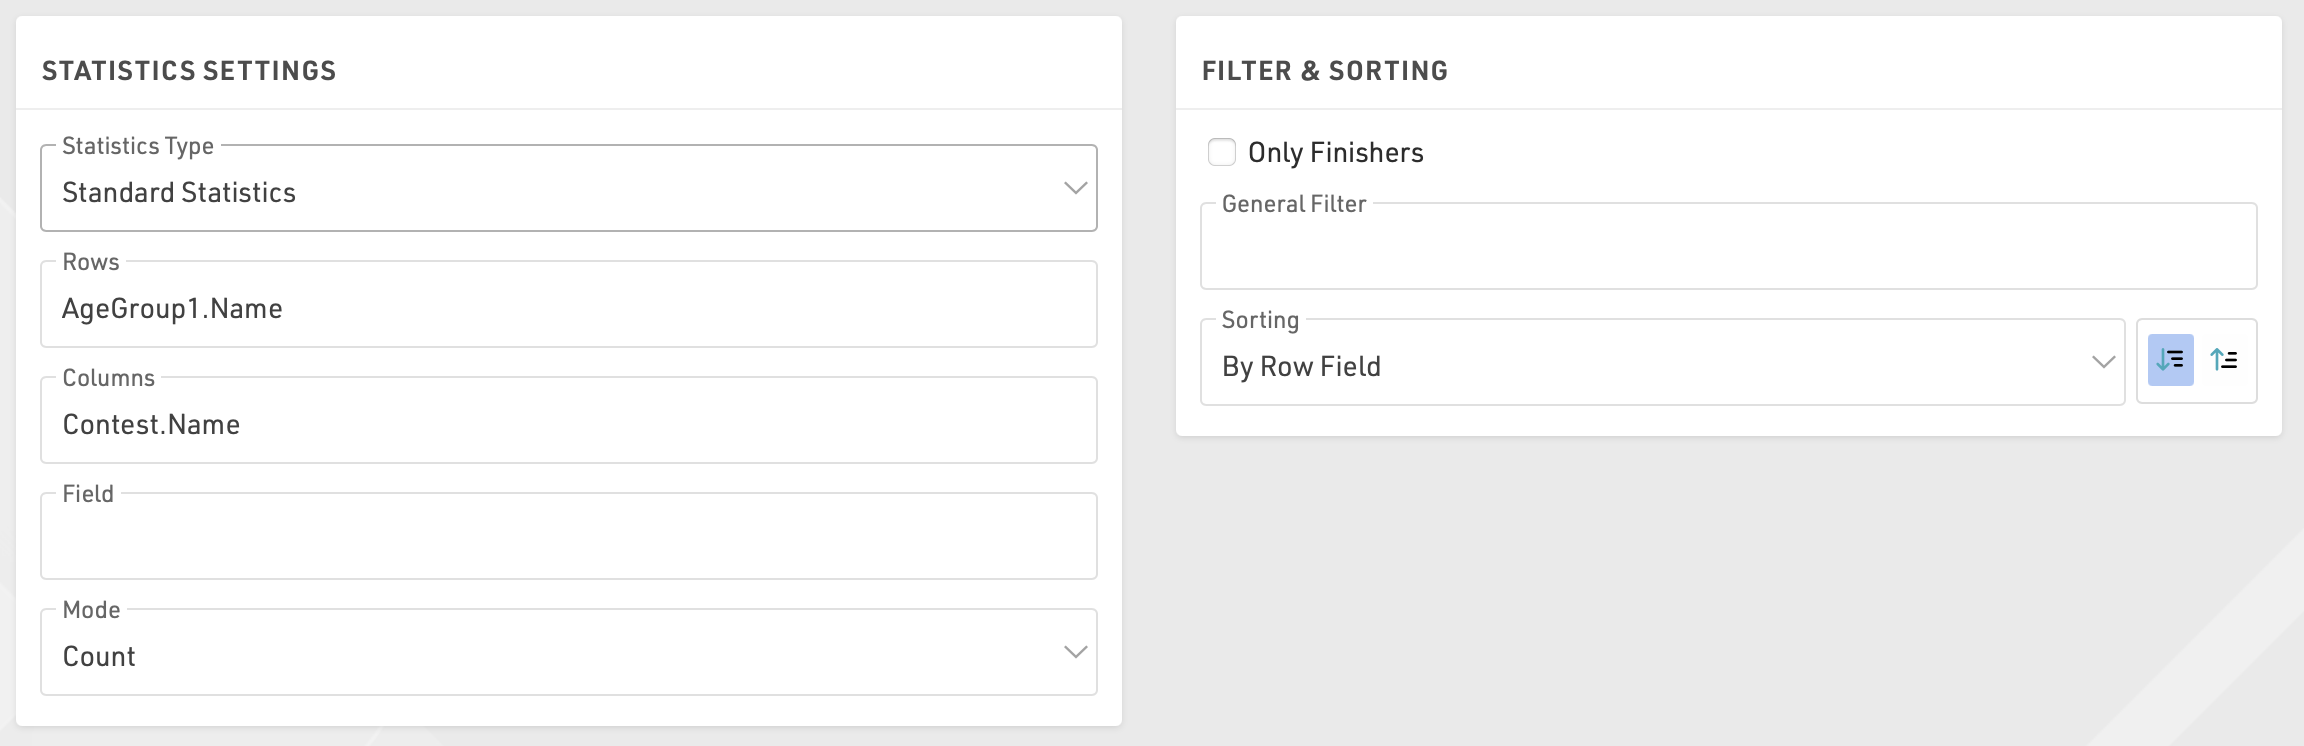
In most cases you will use the mode Count: the number of participants matching the row and the column field will be counted.
Alternatively, you can select a field over which the minimum/maximum/average/sum will be calculated.
If you want to restrict the participants considered for the statistics, enable Only Finishers or enter a General Filter.
Special Types of Statistics
Besides these statistics there are some special types of statistics:
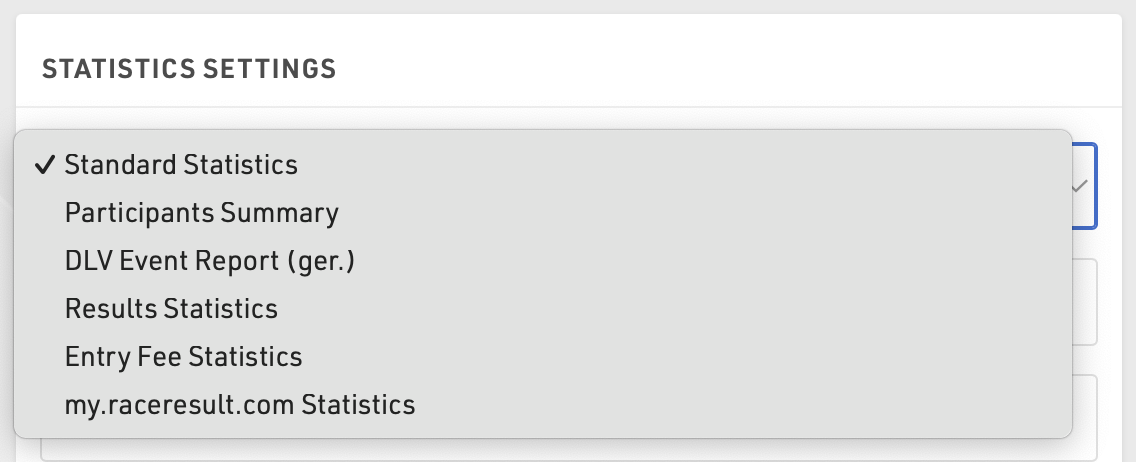
- Participants Summary creates a PDF with a general statistics of the event
- DLV is a report for German Athletics Federation
- Results Statistics shows how many participants have a time in each special result
- Entry Fee Statistics lists all entry fees and calculate the sum over all participants for each entry fee
- my.raceresult.com Statistics mirror the my.raceresult.com Statistics